
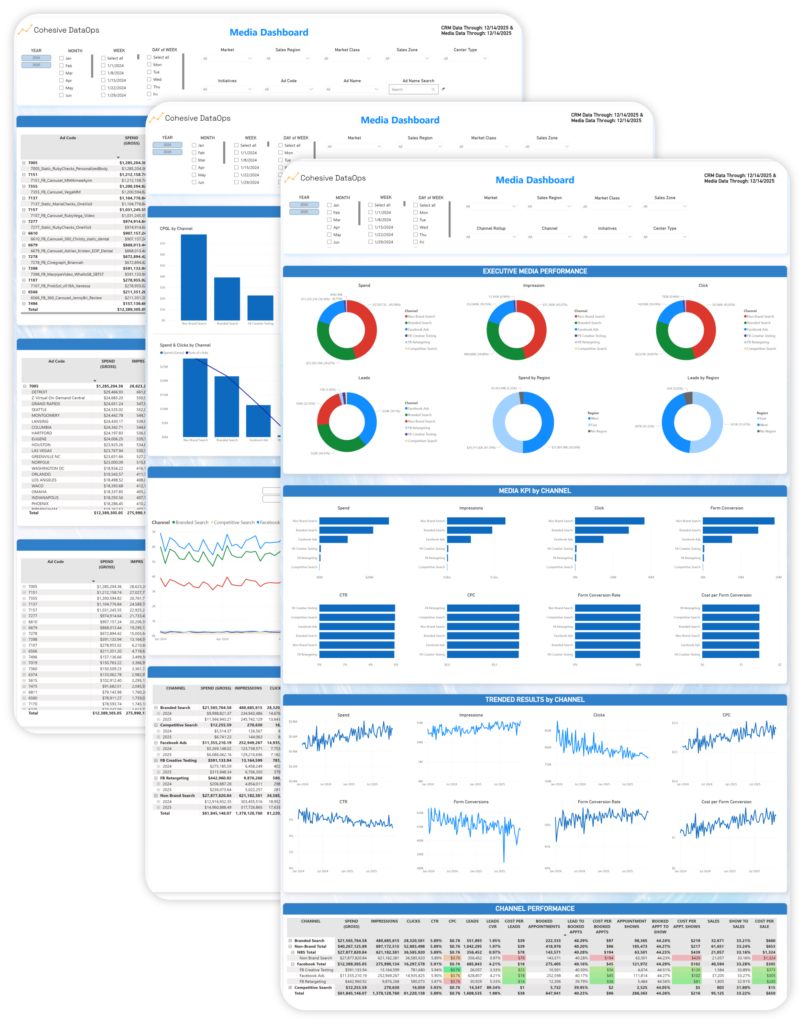
This Power BI dashboard demonstrates how paid media performance translates into real patient demand and revenue within an appointment-based healthcare model. It connects media investment to downstream operational outcomes—moving beyond clicks and leads to focus on bookings, show rates, and closed sales.
Built to reflect how healthcare organizations actually measure success, the dashboard enables detailed analysis from media spend through appointments set, appointment shows, and revenue. Users can slice and compare performance across campaigns, channels, markets, services, and time to understand not just volume, but quality and efficiency.
KPIs: Cost, impressions, clicks, click-through rate, cost per click, qualified leads, appointments set, appointment shows, sales, and revenue.This sample uses representative healthcare workflows and anonymized data to illustrate analytical depth, structural flexibility, and how Power BI can support end-to-end performance visibility for healthcare marketing and operations teams.
Healthcare Power BI Demand Gen Dashboard
Data Sources
Just a few examples

Meta Ads

GA4
Google Ads
Salesforce

Epic
Bing
Data Warehouses
Single Source of Truth

Azure
Dashboards
Owned by you. Built to scale. Easy to extend.

Power BI
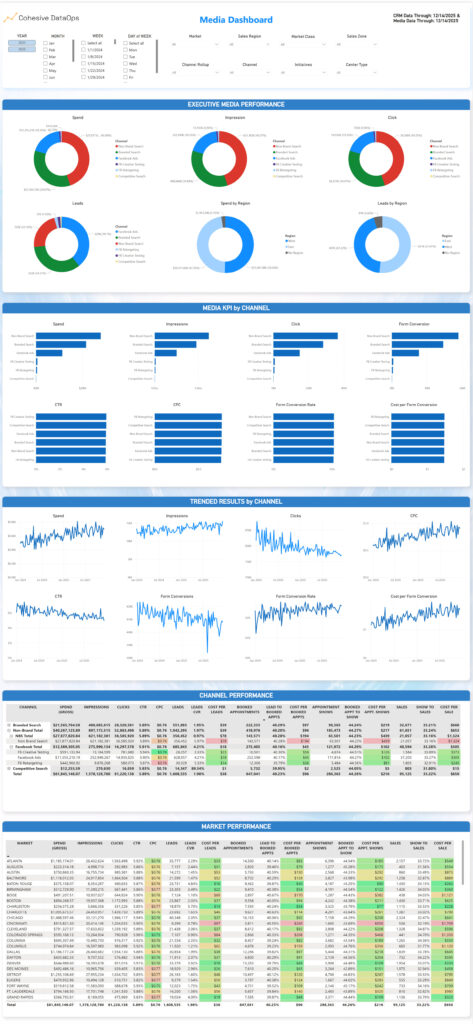
Executive Media Tab
Overview:
This tab provides a high-level view of paid media performance across all channels, markets, and regions, connecting media investment to funnel activity in a single executive summary. It aggregates spend, impressions, clicks, leads, and downstream outcomes so stakeholders can quickly understand how marketing dollars are being allocated and where performance is concentrated. By unifying media data with CRM funnel metrics, it ties advertising activity directly to business impact and financial results.
Insights:
This view surfaces how different channels and regions contribute to overall performance, highlighting imbalances between spend and outcomes that may not be visible in isolated reports. It allows teams to quickly assess whether growth is being driven by volume expansion, efficiency gains, or mix shifts across channels.
Because all metrics are transparent and fully traceable, teams can move from high-level signal to deeper analysis with confidence, without relying on black-box attribution or disconnected summaries.
Global Header Filters

Overview:
This global dashboard header provides a unified control layer for analyzing healthcare media performance across time, geography, channel, and operational dimensions. It enables rapid context switching without rebuilding analyses, allowing users to move seamlessly between national, regional, market, and initiative-level views.
All downstream visuals—including KPIs, trends, funnel metrics, and cost efficiency views—respond instantly to these selections, ensuring analytical consistency across the entire report. Date indicators clearly communicate data freshness for both media and CRM sources.
Insights:
By centralizing filtering at the top of the report, this design removes friction from performance analysis and supports faster decision-making. Teams can quickly isolate differences in booking performance by market, channel mix, sales region, or initiative without losing metric alignment.
This structure enables stakeholders to answer questions such as where demand is accelerating or slowing, which regions or center types are driving stronger appointment quality, and how performance changes across time periods—all within a single, cohesive analytical framework.
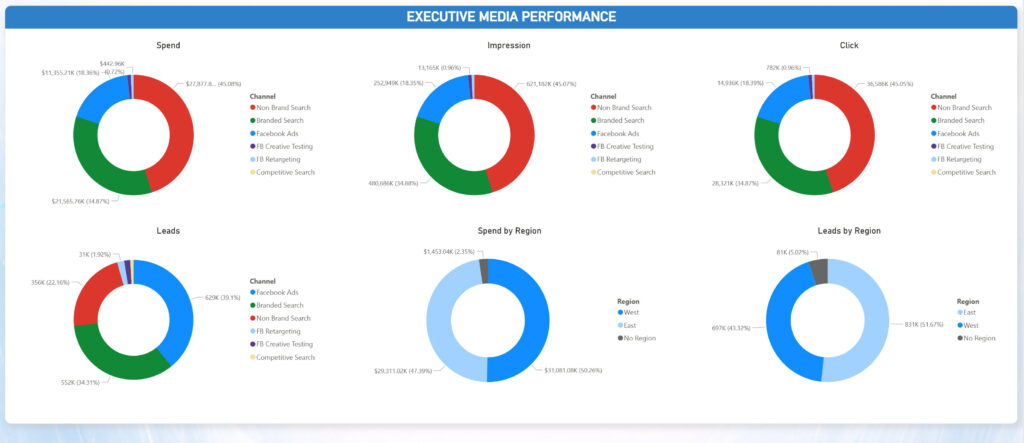
Executive Media Performance
Overview:
This section provides an executive level view of how paid media performance is distributed across channels and regions. By summarizing spend, impressions, clicks, and leads in proportional views, it shows how investment and engagement are allocated across the media mix and geographic footprint at a glance.
Insights:
Viewing channel and regional distributions side by side makes it easy to identify concentration, imbalance, and alignment between spend and demand. This perspective helps teams quickly assess whether media mix and geographic allocation reflect strategic priorities, and where shifts in investment could improve efficiency and downstream business outcomes.
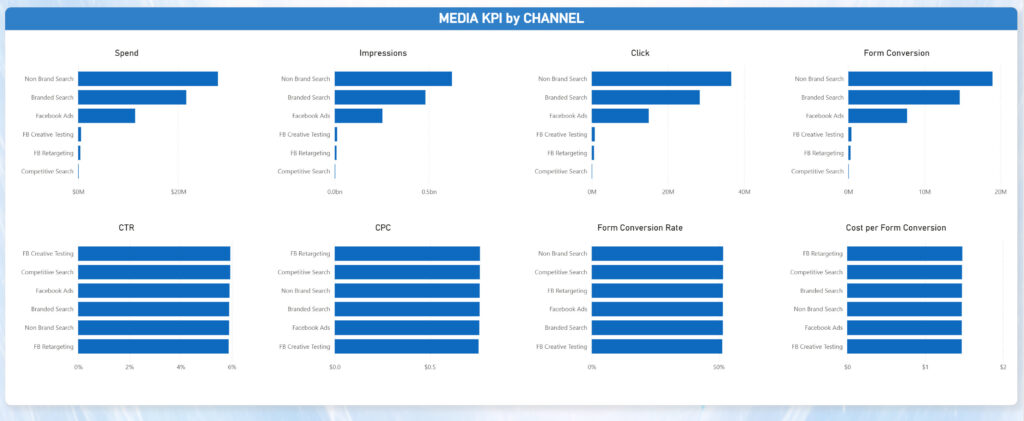
Media KPI by Channel
Overview:
This section breaks down core media KPIs by channel, pairing volume metrics such as spend, impressions, clicks, and conversions with efficiency indicators including CTR, CPC, conversion rate, and cost per conversion. By presenting each metric side by side, it provides a consistent framework for evaluating how each channel contributes to demand generation and overall performance.
Insights:
Viewing volume and efficiency together makes it easy to distinguish channels that drive scale from those that drive efficiency. This layout highlights where strong engagement translates into conversions, where costs are rising without proportional return, and which channels present opportunities for optimization, reallocation, or expansion based on true performance rather than surface level volume alone.
Trended Results by Channel

Overview:
This view tracks how paid media performance changes over time by channel, showing spend, reach, engagement, and efficiency metrics moving together. By aligning volume and cost indicators in a single trend view, it provides context for how channels evolve as investment scales.
Insights:
This view reveals whether growth is driven by improving efficiency or rising costs. It helps identify channels that are scaling sustainably versus those showing early signs of fatigue, cost pressure, or diminishing returns that may require optimization or reallocation.
Channel Performance
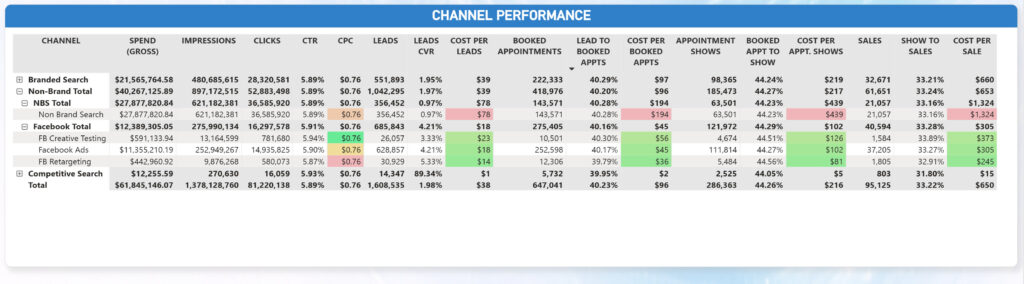
Overview:
This view compares performance and efficiency across channels and sub-channels, connecting media spend, engagement, and conversion outcomes all the way through appointments, sales, and cost per sale. It provides a single, end-to-end view of how each channel contributes across the full booking funnel.
Expandable rows allow users to drill into sub-channels—such as branded vs. non-branded search, creative testing, or retargeting—while preserving roll-up context at the channel level.
Insights:
By aligning volume, conversion rates, and unit economics side by side, this table highlights which channels are driving scalable results versus those that appear efficient early but break down deeper in the funnel. It quickly surfaces where cost inflation occurs, where conversion strength offsets higher spend, and where optimization or budget reallocation will have the greatest impact.
This view helps teams move beyond surface-level efficiency metrics to understand true channel contribution to booked appointments and revenue.
Market Performance
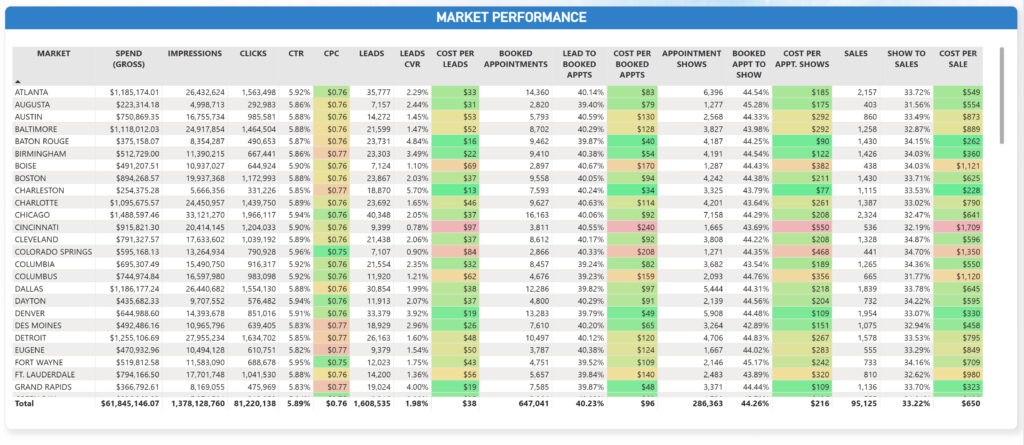
Overview:
This table compares performance by market across the full media-to-sales funnel, showing how each region converts spend into appointments, sales, and revenue. By standardizing efficiency, conversion, and unit-economics metrics in one view, it enables clean, apples-to-apples market comparison.Insights:
This view quickly surfaces which markets deliver strong downstream performance—such as higher close rates or lower cost per sale—and which see rising costs without proportional return. It highlights where budget is scaling efficiently versus where optimization, operational review, or reallocation is needed to improve overall impact.CRM Paid Media Tab
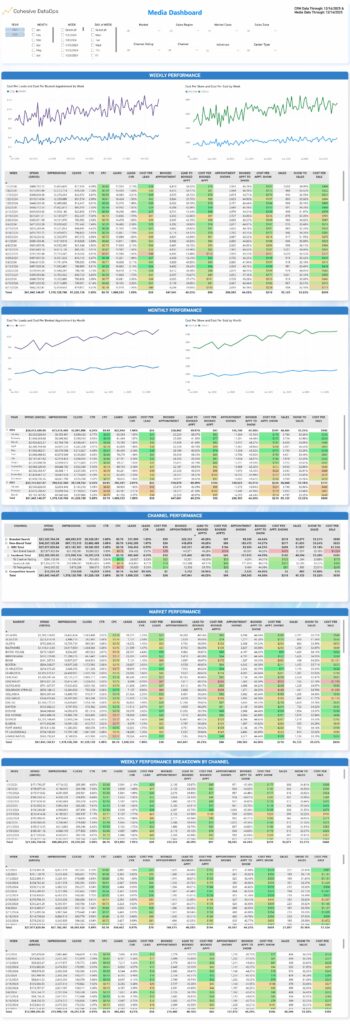
Overview:
The CRM & Paid Media tab connects paid media activity directly to downstream CRM outcomes, linking spend, impressions, clicks, and leads to booked appointments, shows, sales, and revenue. By unifying media platform data with CRM funnel metrics in a single view, this tab provides a clear end to end picture of how marketing investment translates into real business results over time, by channel and by market.
Insights:
This view makes it easy to see where efficiency is gained or lost as leads move through the funnel, separating surface level media performance from true revenue impact. By exposing weekly and monthly trends alongside channel and market level breakdowns, teams can identify where spend is driving profitable growth, where bottlenecks emerge later in the funnel, and where optimization or budget reallocation will have the greatest impact on financial outcomes.
Weekly Performance
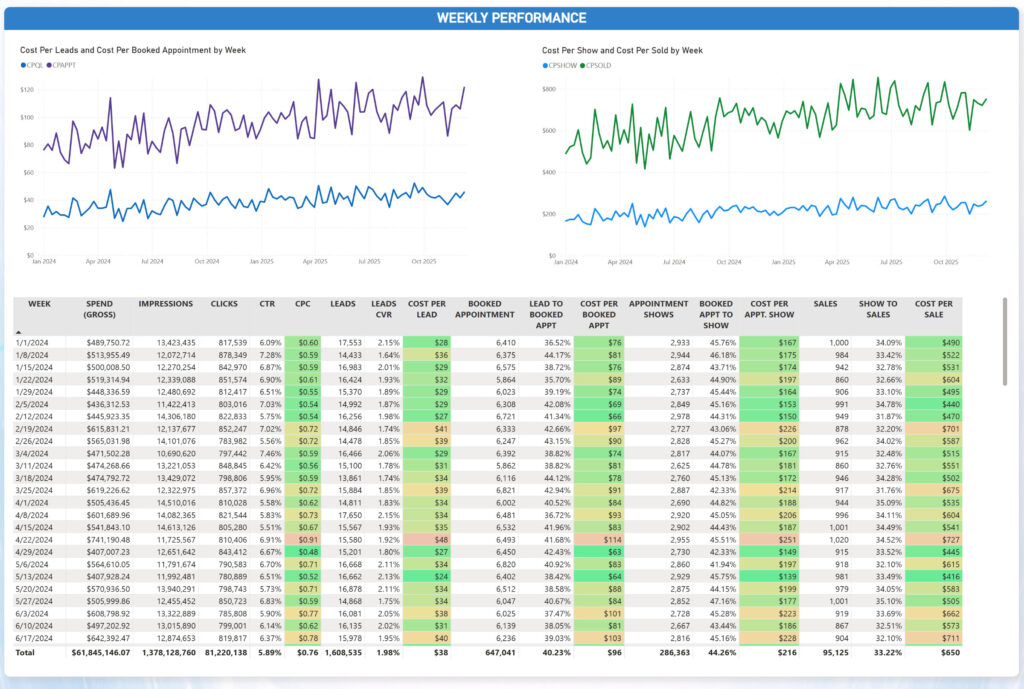
Overview:
This view tracks week-to-week efficiency across the full booking funnel, from cost per lead through cost per booked appointment, show, and sale. By pairing upstream and downstream unit economics, it shows how efficiency evolves as volume fluctuates over time.
Insights:
Comparing these metrics side by side makes it easy to see whether increases in spend are translating into stable or improving efficiency—or if cost pressure is emerging deeper in the funnel. The trendlines help teams separate normal weekly volatility from meaningful performance shifts that warrant optimization, budget rebalancing, or operational follow-up.
Monthly Performance

Overview:
The Monthly Performance view rolls up paid media and CRM results by month, showing how spend, volume, and efficiency evolve over longer time horizons. By combining trend lines with detailed monthly tables, it connects media investment to downstream funnel outcomes such as booked appointments, shows, sales, and cost efficiency in a single, consistent view.
Insights:
This view makes it easier to separate short-term volatility from sustained performance trends, revealing whether changes in spend are driving durable improvements or masking emerging efficiency issues. By analyzing month over month shifts across the full funnel, teams can identify seasonality effects, validate optimization impact, and make more confident planning and forecasting decisions tied to financial results.
Channel Performance

Overview:
This view compares performance and efficiency across channels and sub-channels, connecting media spend, engagement, and conversion outcomes all the way through appointments, sales, and cost per sale. It provides a single, end-to-end view of how each channel contributes across the full booking funnel.
Expandable rows allow users to drill into sub-channels—such as branded vs. non-branded search, creative testing, or retargeting—while preserving roll-up context at the channel level.
Insights:
By aligning volume, conversion rates, and unit economics side by side, this table highlights which channels are driving scalable results versus those that appear efficient early but break down deeper in the funnel. It quickly surfaces where cost inflation occurs, where conversion strength offsets higher spend, and where optimization or budget reallocation will have the greatest impact.
This view helps teams move beyond surface-level efficiency metrics to understand true channel contribution to booked appointments and revenue.
Market Performance

Overview:
This table compares performance by market across the full media-to-sales funnel, showing how each region converts spend into appointments, sales, and revenue. By standardizing efficiency, conversion, and unit-economics metrics in one view, it enables clean, apples-to-apples market comparison.
Insights:
This view quickly surfaces which markets deliver strong downstream performance—such as higher close rates or lower cost per sale—and which see rising costs without proportional return. It highlights where budget is scaling efficiently versus where optimization, operational review, or reallocation is needed to improve overall impact.
Weekly Performance Breakdown by Channel

Overview:
The Weekly Performance Breakdown by Channel provides a granular, week-by-week view of how each channel is performing across spend, engagement, conversion, and downstream CRM outcomes. By aligning weekly delivery with full-funnel metrics in a single table, it enables precise tracking of efficiency, pacing, and conversion flow at the channel level.
Insights:
This view makes it easy to spot inflection points where performance meaningfully shifts, separating normal weekly variability from true changes in efficiency or demand. By comparing channels side by side over time, teams can quickly identify which channels are scaling effectively, where costs are rising faster than outcomes, and where short-term adjustments can have the greatest impact on revenue and financial results.
Budget Pacing Tab
Overview:
This tab brings together budget targets, spend to date, and projected outcomes to show how paid media investment is pacing against plan at both the market and channel level. By combining gross budget, actual spend, remaining budget, and projected funnel results in a single view, it provides a clear picture of whether investment is tracking toward monthly objectives.
The pacing views connect budget delivery directly to downstream performance, allowing teams to understand not just how much has been spent, but what that spend is expected to produce in terms of leads, appointments, sales, and cash impact by month end.
Insights:
This view highlights where pacing risk exists, including channels or markets that are overspending, underspending, or trending off plan relative to goals. By surfacing required daily pace, remaining budget pressure, and projected outcomes side by side, it enables proactive budget adjustments before gaps widen.
It supports more disciplined in month management by helping teams reallocate spend toward higher performing channels, correct pacing issues early, and align investment decisions with expected financial results rather than relying on static budget tracking alone.
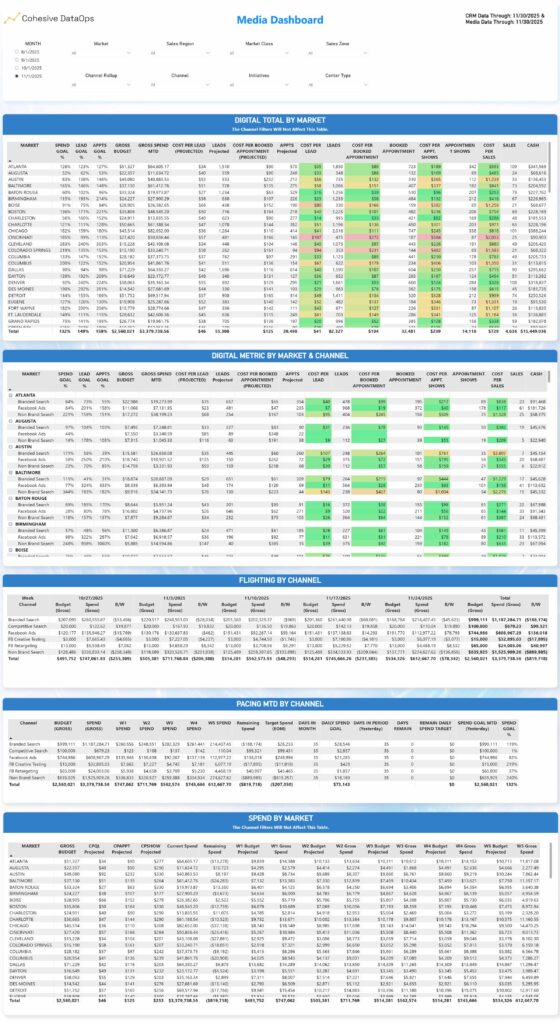
Digital Total by Market

Overview:
This view compares budget pacing, goal attainment, and projected funnel outcomes by market to show whether performance is tracking to plan. By aligning gross budget, spend to date, projected leads and appointments, and downstream cost metrics in one table, it provides a clear snapshot of market-level performance against targets.
Insights:
This view highlights where markets are over- or under-performing early, before gaps widen. It helps teams see not just where spend is ahead or behind plan, but how pacing translates into expected sales and cash impact—enabling proactive budget, target, and market strategy adjustments.
Digital Metric by Market & Channel
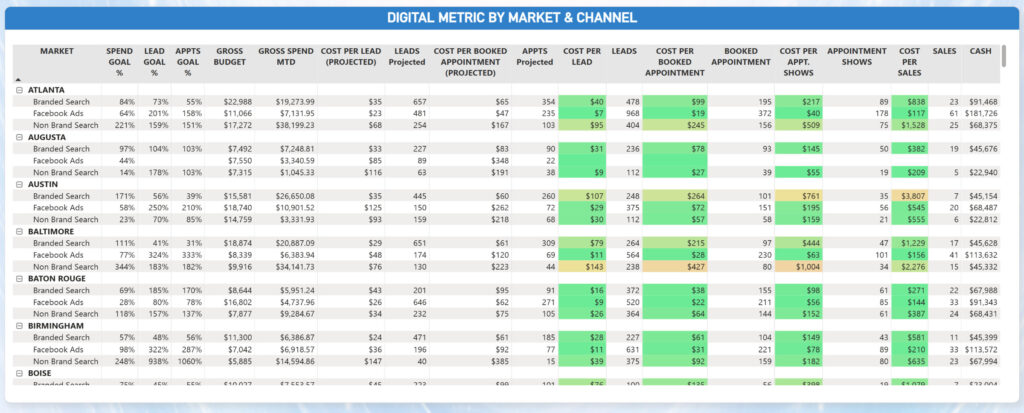
Overview:
This view breaks down digital performance by market and channel, connecting budget pacing, lead and appointment goals, and downstream sales outcomes in a single table. By expanding each market to its underlying channels, it enables side-by-side comparison of how different tactics perform within the same local context.
Insights:
This view reveals which channels are truly driving market performance versus inflating volume without efficient progression through the funnel. It helps teams identify where channel mix is misaligned with goals, where cost efficiency degrades between lead and appointment stages, and where reallocating spend within a market—not just across markets—can materially improve outcomes.
Flighting by Channel

Overview:
This view tracks weekly budget pacing by channel, comparing planned flight budgets to actual spend across each week. By aligning budget, spend, and variance side by side, it provides immediate visibility into how each channel is pacing relative to plan throughout the flight.
Insights:
This view quickly surfaces where spend is accelerating, lagging, or holding steady, enabling teams to distinguish intentional front-loading from unplanned overdelivery. It supports in-flight optimization by identifying when channels need pacing corrections, budget reallocation, or intervention before variances compound and impact overall performance goals.
Pacing MTD by Channel
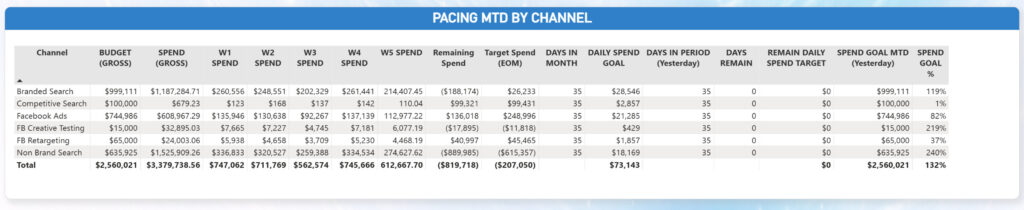
Overview:
This view shows how month-to-date spend is pacing against planned channel budgets. It combines cumulative spend, weekly delivery, remaining budget, and required daily pace into a single table to provide a clear, real-time view of budget health by channel.
Insights:
This view makes pacing risk immediately visible by highlighting which channels are overspending, underspending, or on track relative to their targets. By connecting spend to remaining time in the month, it enables proactive adjustments to daily targets and budget allocation before over- or under-delivery becomes difficult to correct.
Spend by Market

Overview:
This view breaks down budget pacing by market, combining total monthly budget, spend to date, remaining budget, and week by week delivery into a single table. By aligning projected weekly budgets with actual spend, it shows how each market is pacing within the month and whether investment is tracking evenly or front loaded.
The structure allows teams to see both the current state and the planned path forward, connecting cumulative monthly pacing with granular weekly execution at the market level.
Insights:
This table highlights markets that are ahead or behind plan and surfaces where pacing issues are driven by specific weeks rather than overall budget size. By comparing projected versus actual spend week by week, teams can identify early acceleration, delayed delivery, or uneven pacing patterns that may impact end of month outcomes.
It enables more precise budget control by supporting market level adjustments during the month, helping teams smooth spend, correct pacing risks, and ensure investment remains aligned with performance expectations and financial targets.
Creative Performance Tab
Overview:
This tab evaluates creative performance across the full funnel, connecting ad level spend and engagement to leads, booked appointments, shows, and sales. By presenting results at the individual ad level and enabling drill down by market and time, it provides a clear view of how each creative execution performs beyond surface level metrics.
The structure allows teams to move seamlessly from a national or aggregate creative view into market specific performance, preserving context while exposing where results diverge across geographies.
Insights:
This view highlights which creative assets are driving efficient downstream outcomes versus those that generate engagement without proportional business impact. By comparing the same ad across markets and weeks, teams can identify creatives that scale consistently, those that require market specific adjustments, and variants that should be refined or retired.
It supports smarter creative optimization by shifting decision making away from clicks alone and toward true business results, helping teams prioritize creative strategies that convert reliably across markets and contribute to sustainable performance growth.
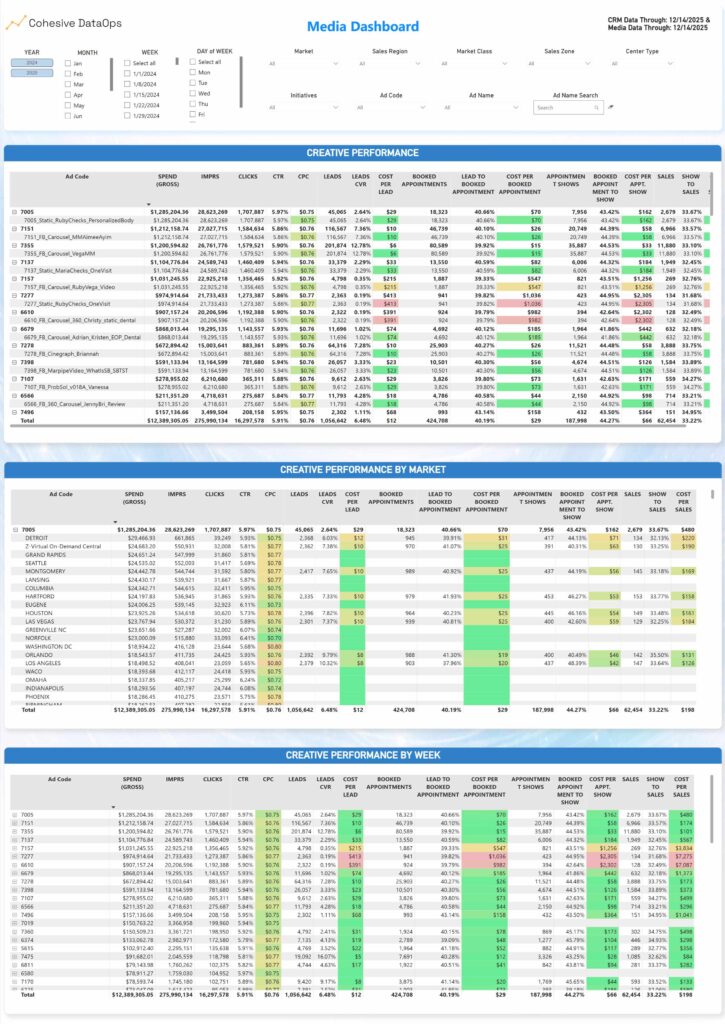
Creative Performance
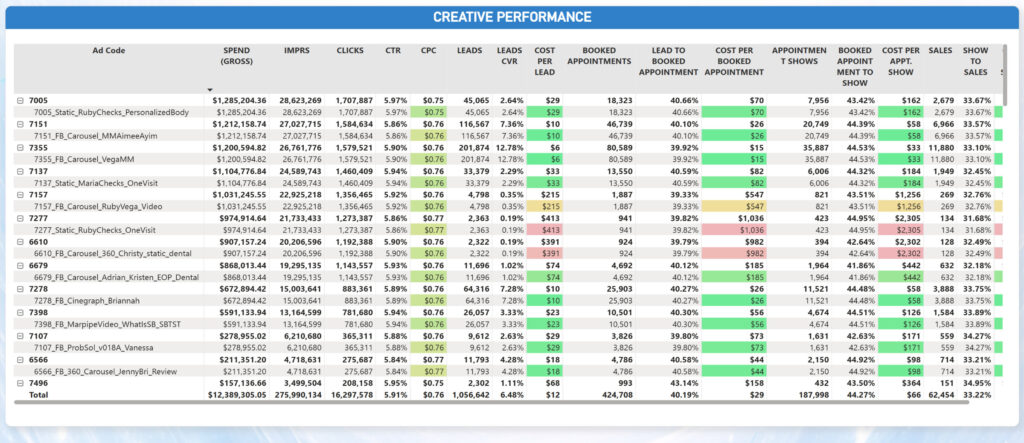
Overview:
This view breaks performance down to the individual ad code and ad name, connecting creative level spend and engagement directly to downstream funnel outcomes. It provides a detailed, execution level view of how each creative performs from impressions and clicks through leads, booked appointments, shows, and sales.
By standardizing efficiency and conversion metrics across all ads, this table makes it easy to evaluate creative effectiveness on a consistent, comparable basis.
Insights:
This view surfaces which ads are driving true business results versus those that generate volume without efficient conversion. By aligning cost, conversion rates, and downstream outcomes side by side, teams can quickly identify winning creatives to scale, underperforming assets to refine, and wasted spend tied to low impact executions.
It supports disciplined creative optimization by ensuring decisions are based on end-to-end performance rather than top of funnel engagement alone, helping teams focus investment on ads that reliably contribute to revenue and growth.
Creative Performance by Market

Overview:
This view measures creative performance end-to-end, connecting spend and engagement to booked appointments, sales, and cost per sale. Results are summarized by ad code and expandable by market, revealing how each creative performs across different geographies.
Insights:
The analysis shows which creatives drive real business outcomes, not just clicks or leads. Market-level expansion exposes where creative performance is consistent, where it breaks down, and which variants scale efficiently versus those that depend on local conditions — guiding creative optimization and budget prioritization.
Creative Performance by Week

Overview:
This view extends creative performance analysis to a weekly level, allowing each ad to be evaluated over time as spend, delivery, and audience exposure evolve. By breaking results into weekly segments, it connects short-term fluctuations in spend and engagement to downstream funnel performance and business outcomes.
This structure makes it possible to assess creative consistency, ramp-up effects, and performance decay without losing visibility into full-funnel efficiency.
Insights:
Weekly granularity highlights when creative performance strengthens or deteriorates, helping teams distinguish sustainable winners from short-lived spikes. Patterns such as improving conversion efficiency after launch, fatigue over time, or performance volatility become immediately visible.
This enables smarter optimization decisions like refreshing creative, adjusting spend timing, or extending high-performing ads, based on clear, week-over-week performance trends rather than aggregate averages.
Channel Performance Tab
Overview:
This tab delivers a consolidated view of paid media performance by channel, combining spend, engagement, lead generation, and downstream CRM outcomes in a single, comparable framework. It enables side-by-side evaluation of how each channel contributes to volume, efficiency, and conversion quality across the full funnel: from impressions and clicks through booked appointments and sales. By aligning media delivery with CRM results, this view connects channel investment directly to performance outcomes and financial impact.
Insights:
Channel-level comparisons surface meaningful tradeoffs between scale and efficiency, highlighting where spend concentration is driving incremental results versus diminishing returns. Trend views and monthly rollups reveal performance stability, seasonality, and shifts in channel effectiveness over time.
Because all metrics are calculated transparently from source data, rather than abstracted through platform black boxes, teams can confidently optimize channel mix, rebalance budgets, and defend performance decisions with clear, auditable logic tied to real business results.

Channel Performance

Overview:
This tab delivers a consolidated view of paid media performance by channel, combining spend, engagement, lead generation, and downstream CRM outcomes in a single, comparable framework. It enables side by side evaluation of how each channel contributes to volume, efficiency, and conversion quality across the full funnel, from impressions and clicks through booked appointments and sales.
By aligning media delivery with CRM results, this view connects channel investment directly to performance outcomes and financial results.
Insights:
Channel level comparisons surface meaningful tradeoffs between scale and efficiency, highlighting where spend concentration is driving incremental results versus diminishing returns. Trend views and monthly rollups reveal performance stability, seasonality, and shifts in channel effectiveness over time.
Because all metrics are calculated transparently from source data rather than abstracted through platform black boxes, teams can confidently optimize channel mix, rebalance budgets, and defend performance decisions with clear, auditable logic tied to real business outcomes.
Paid Metric Trend by Channel

Overview:
This view tracks creative delivery and performance over time, showing how individual ads pace against budget while maintaining efficiency and downstream results. It provides visibility into whether creative rotation and investment are aligned with performance, not just spend targets.
Insights:
The view highlights where creatives are over-invested, under-utilized, or correctly paced relative to their impact on appointments and sales. By tying pacing to outcomes, teams can quickly identify creatives that should be scaled, capped, or rotated out — preventing budget waste and keeping high-performing ads in market longer.
Channel Performance by Month & Year

Overview:
This view shows how channel performance evolves over time with drill-down detail, combining a high-level channel summary with a time-based pivot by year and month. It connects spend, engagement, conversion rates, and downstream outcomes to show how each channel performs end-to-end as conditions change.Insights:
By exposing trends at both the aggregate and time-sliced level, this view helps distinguish seasonality, budget shifts, and true efficiency changes within each channel. Teams can quickly see whether performance improvements are driven by increased investment or stronger unit economics — enabling more informed channel planning, forecasting, and optimization decisions.Region Performance Tab
Overview:
This tab provides a geographic view of paid media performance, allowing teams to evaluate results by region, zone, market, and state using a consistent set of funnel and efficiency metrics. It supports dynamic metric selection so users can analyze spend, engagement, lead volume, appointment activity, and sales performance through a single regional lens.
By combining ranked distributions, trend analysis, and spatial mapping, this view helps translate national media performance into clear regional accountability and opportunity identification.
Insights:
Regional comparisons quickly surface markets that are outperforming or underperforming relative to spend, highlighting where scale is driving efficient growth versus where cost pressure or conversion friction exists. Weekly trend lines expose volatility, seasonality, and momentum shifts within individual markets, while heatmap tables provide immediate visibility into efficiency and quality metrics at scale.
Because the model supports large data volumes and complex dimensional slicing, this tab is particularly effective for identifying optimization opportunities across dense market structures and long time horizons, enabling confident regional budget reallocation and performance forecasting.

Region Performance by Selected Metric

Overview:
This view shows how performance distributes across regions, zones, and individual markets using a single metric selector. Users can switch between spend, volume, efficiency, and outcome metrics, with all charts updating in sync to reveal where activity and results are concentrated geographically.
Insights:
By pairing a high-level regional summary with ranked zone and market breakdowns, this view highlights which geographies drive scale versus efficiency. It helps teams quickly spot concentration risk, emerging growth markets, and areas where investment may be misaligned with results—supporting smarter geographic planning, budget rebalancing, and expansion decisions.
Region Performance Rollup
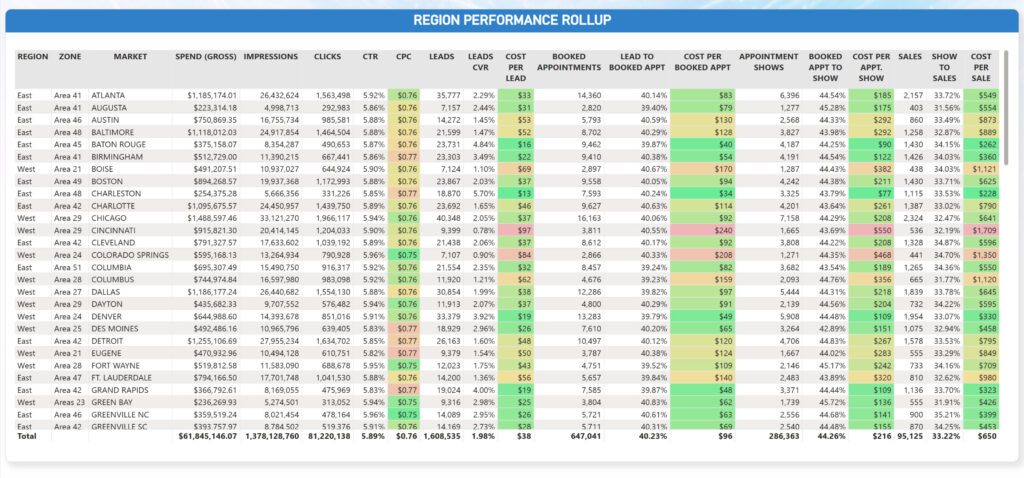
Overview:
This table provides a full regional rollup of paid media performance, consolidating spend, engagement, funnel progression, and revenue outcomes across region, zone, and market. It connects media delivery metrics directly to downstream CRM results, enabling side by side comparison of efficiency and volume across every stage of the customer journey. The layout is designed to support large scale analysis, allowing users to scan hundreds of markets while maintaining visibility into both cost control and business impact.Insights:
Conditional formatting highlights efficiency and risk areas instantly, making it easy to identify markets with strong conversion quality, appointment yield, and sales performance relative to spend. Comparing lead rates, appointment progression, and sale rates across regions reveals structural differences in market behavior, operational performance, and media effectiveness. Because this view aggregates high dimensional data at scale, it is particularly effective in Power BI, where increased data volume and complexity improve analytical clarity, support advanced filtering, and enable confident budget optimization across regions without relying on opaque or black box modeling.Keyword Peformance Tab
Overview:
This tab provides a full-funnel view of paid search keyword performance, connecting keyword-level spend and efficiency to downstream conversions and business outcomes. By combining media delivery metrics with CRM conversion data, it shows which search terms are driving real demand—not just traffic.
The structure supports analysis across markets, campaigns, and keyword themes, making it easy to evaluate scale, efficiency, and conversion quality at the most granular level.
Insights:
Keyword-level performance highlights where spend concentration aligns—or fails to align—with conversion efficiency and cost control. High-volume terms can be assessed against CPC, conversion rate, and cost per form conversion to identify true drivers of growth versus budget drains.
This view enables precise optimization decisions such as reallocating spend toward high-intent terms, pruning inefficient keywords, refining match types, and improving geographic or campaign targeting—without relying on black-box platform reporting.
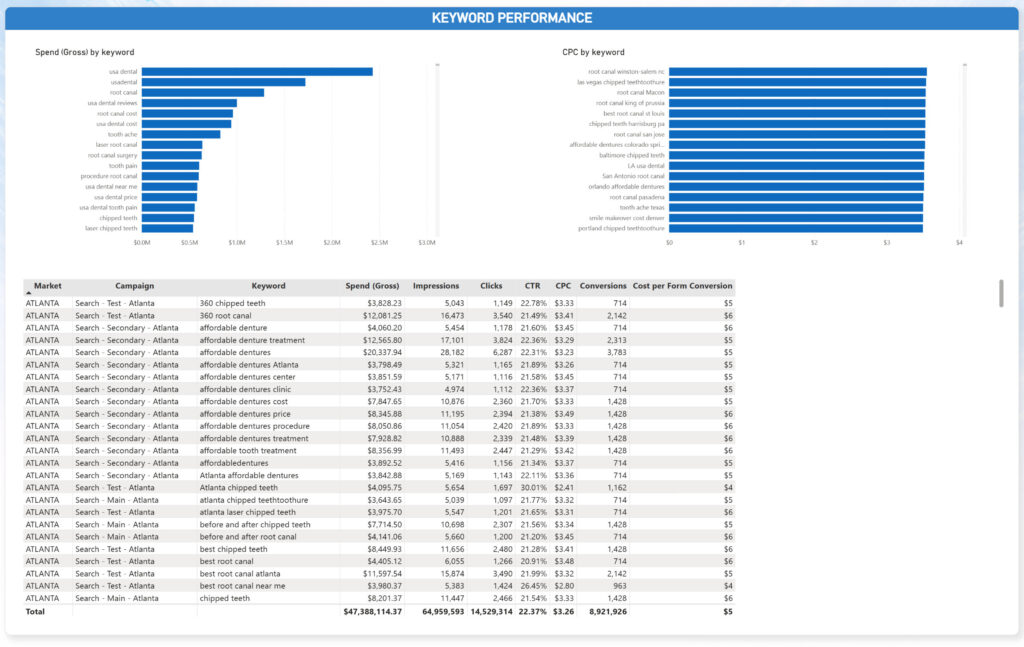
Keyword Performance

Overview:
This table breaks down paid search performance at the keyword level by market and campaign, directly linking spend and engagement to conversions and cost efficiency. It surfaces how individual queries contribute to volume, conversion outcomes, and overall efficiency within each market.
Insights:
Keyword-level visibility makes it easy to identify high-intent terms that consistently convert efficiently, as well as keywords that absorb spend without proportional results. These patterns support precise optimization decisions—such as bid adjustments, keyword expansion, or pruning—tailored to each market’s demand and performance profile.