
Sample Dashboards
Explore Cohesive DataOps dashboards built across multiple platforms and real-world use cases. These examples showcase how we combine data from multiple media properties such as paid search, paid social, and display, with downstream CRM and revenue data to connect ad spend and activity directly to business outcomes.
Each sample demonstrates a unified, multi-source analytics approach: media performance, funnel progression, and efficiency metrics modeled together in a single, consistent reporting layer. Rather than viewing channels or KPIs in isolation, these dashboards show how investment translates through leads, appointments, opportunities, sales, and revenue.
Use the examples below to explore how Cohesive DataOps designs scalable, transparent dashboards that align marketing execution with real operational and financial results. Built on proven tools, our dashboards avoid black-box reporting, fragile custom logic, and platform lock-in, giving you transparent, scalable analytics you fully own and can evolve over time.
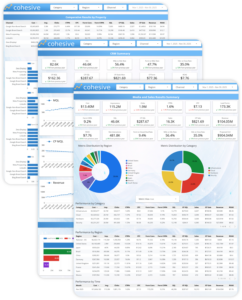
Global Tech Looker Studio
Demand Gen Dashboard
This Looker Studio dashboard demonstrates a full-funnel demand generation reporting framework for a global B2B technology program. It connects paid media performance to downstream CRM outcomes, enabling analysis from spend and engagement through leads, pipeline, revenue, and return on ad spend.
The dashboard emphasizes flexibility and transparency, allowing users to slice performance by channel, region, category, and time while maintaining consistent metrics across views. It’s designed for teams that need fast insight, easy sharing, and a clear source of truth without complex tooling overhead.
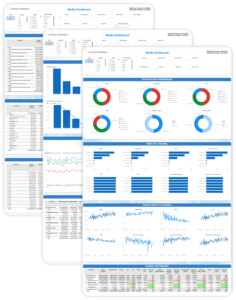
Healthcare Power BI
Demand Gen Dashboard
This Power BI dashboard illustrates how marketing performance translates into real healthcare outcomes, including appointments booked, shows, sales, and revenue. Built for a multi-market healthcare services organization, it connects media spend, operational funnel metrics, and downstream business results in a single, cohesive view.
Designed for scale and complexity, this experience leverages Power BI’s strengths in handling large datasets, dense fact tables, and advanced calculations. It supports deeper operational analysis, combining budget pacing, funnel efficiency, and market-level performance, to enable proactive optimization in high-volume, high-stakes environments where accuracy, performance, and clarity are critical.