In today’s data-driven economy, many organizations find themselves drowning in data but starving for insight. Marketing, sales, and operations teams rely on dozens of platforms to run their businesses, yet the data generated by those systems is often disconnected, inconsistently defined, and difficult to measure end to end.
This is where a well-designed DataOps program becomes essential. DataOps provides the structure, processes, and technical foundation needed to unify fragmented data sources, standardize measurement, and deliver reliable analytics at scale. Rather than treating reporting as a collection of one-off dashboards or manual exports, DataOps focuses on building durable pipelines, shared definitions, and analytics environments that evolve alongside the business.
Without this foundation, organizations struggle to answer basic questions about performance, efficiency, and return on investment. Fragmented data leads to inconsistent reporting, eroded trust in metrics, and slower decision-making, especially as data volume and complexity grow. With a strong DataOps approach in place, these challenges become opportunities to improve visibility, alignment, and confidence across teams.
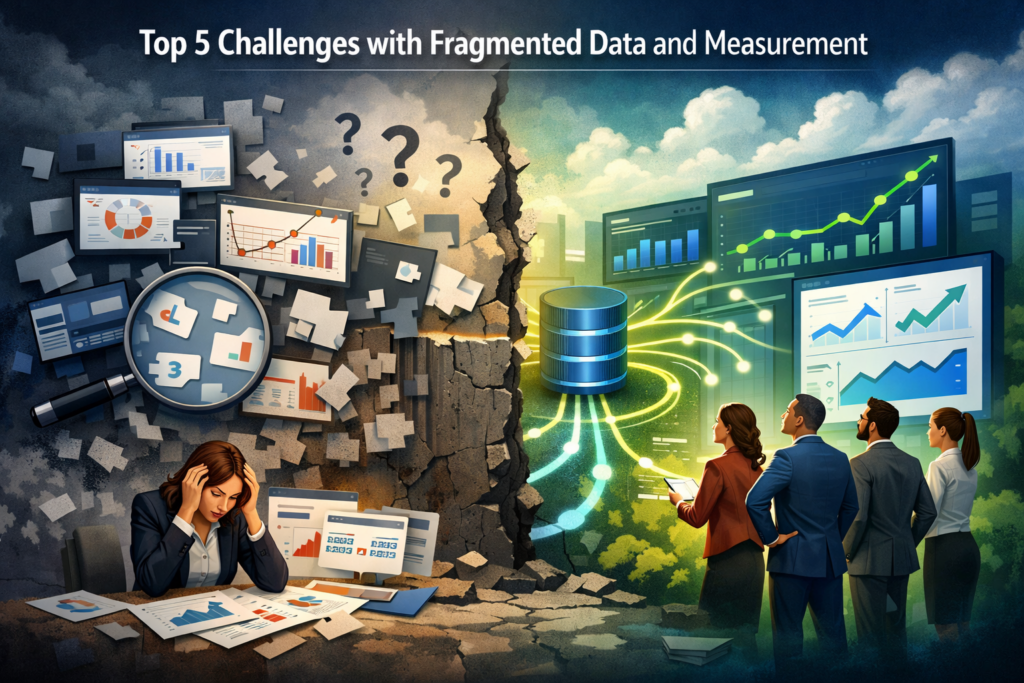
Below are the five most common challenges organizations face when data and measurement are fragmented, and why addressing them is critical for turning analytics into a strategic asset.
Challenge 1: Siloed Systems and Disconnected Data Sources
Most organizations accumulate tools faster than they unify data. Paid media platforms, web analytics tools, CRM systems, and internal sales databases all operate independently, each with its own schema, naming conventions, and reporting logic. When these systems are not reliably integrated, performance measurement becomes fragmented by default.
Nearly half of businesses report that fragmented data is a primary barrier to effective analytics and insight generation¹. This fragmentation forces teams to reconcile conflicting numbers across reports, slows analysis, and reduces confidence in executive summaries.
A DataOps program addresses this by consolidating data into a centralized, AI and analytics-ready warehouse, and enforcing consistent joins across systems. This enables dashboards that reflect the full journey from spend to outcome rather than isolated slices of activity.
Challenge 2: Poor Data Quality and Erosion of Trust
Fragmentation often leads to duplicated records, inconsistent timestamps, mismatched identifiers, and conflicting definitions of core metrics. Over time, this erodes trust in analytics outputs, even when data volume is high.
Industry research shows that many organizations believe a meaningful portion of their data is inaccurate or unreliable, limiting their ability to confidently support strategic decision-making². When stakeholders cannot trust the numbers, dashboards become reference material rather than tools for action.
DataOps mitigates this risk through standardized transformation logic, validation checks, and governed metric definitions. By treating data quality as an operational discipline rather than a one-time cleanup, organizations can restore confidence in analytics across teams.
Challenge 3: Inconsistent Measurement Across Teams
Fragmented data environments often reflect fragmented organizational priorities. Marketing teams focus on impressions, clicks, and cost efficiency, while sales teams prioritize pipeline, revenue, and close rates. Without shared definitions and integrated measurement, each group optimizes for its own metrics rather than shared outcomes.
Research consistently shows that inconsistent data standards and organizational silos undermine accurate measurement and strategic alignment². When teams cannot reconcile their views of performance, decision-making slows and accountability weakens.
A strong DataOps framework establishes common funnel definitions and aligns metrics across functions. This enables consistent evaluation of performance across channels, markets, and teams using shared logic rather than competing interpretations.
Challenge 4: Limited Ability to Analyze Performance in Context
Fragmented reporting environments often prevent teams from seeing how performance changes over time or across dimensions. Data may exist, but not in a structure that supports trend analysis, drill-downs, or side-by-side comparisons.
This limitation becomes especially apparent when organizations attempt to evaluate performance across channels or markets. Without a unified model, teams rely on static exports or platform-specific reports that lack context.
Unified analytics environments, such as a scalable Power BI dashboard sample or a flexible Looker Studio dashboard example, allow teams to explore performance dynamically. When supported by a DataOps foundation, these tools deliver consistent, contextual insight rather than isolated snapshots.
Challenge 5: Analytics That Do Not Scale with Complexity
As organizations grow, fragmented data systems become increasingly brittle. What works for a handful of markets or channels breaks down when volume increases, reporting needs expand, or historical depth becomes important.
Enterprise research highlights mass data fragmentation as a systemic challenge, particularly as data volumes increase and analytics use cases expand beyond basic reporting¹. Fragmented architectures limit the ability to support forecasting, optimization, and advanced analytics initiatives.
DataOps approach designs analytics for scale from the start. This includes performance-optimized warehouses, modular transformations, and dashboard architectures that can handle large datasets and complex slicing without degrading usability or trust.
Turning Fragmentation into an Advantage
Solving fragmentation is not about adding more tools or dashboards. It requires a deliberate strategy that prioritizes data foundations, shared measurement, and operational discipline.
Organizations that invest in DataOps gain several advantages:
- Consolidated data environments that support end-to-end analysis
- Standardized metrics that align teams around shared outcomes
- Scalable analytics platforms that adapt as complexity grows
- Transparent logic that avoids black-box reporting and vendor lock-in
With these elements in place, dashboards become tools for decision-making rather than artifacts of reporting.
Conclusion
Fragmented data and measurement challenges are not inevitable. They result from disconnected systems, inconsistent definitions, and analytics that were never designed to scale. Organizations that address these issues through a structured DataOps program gain clearer visibility, stronger alignment, and greater confidence in their decisions.
Whether evaluating a Power BI dashboard sample designed for high-volume, complex analysis or a Looker Studio dashboard example built for flexible, cross-channel reporting, the underlying principle remains the same. Reliable insight starts with unified data, disciplined processes, and analytics that connect activity to outcomes.
Sources
- Performance Marketing World. Nearly half of businesses plagued by data fragmentation.
https://www.performancemarketingworld.com/article/1933288/nearly-half-businesses-plagued-data-fragmentation
- Information Age. Mass data fragmentation is holding businesses back.
https://www.information-age.com/mass-data-fragmentation-13753/